How Many People Are There in the UK - Updated Population
 |
The current population of the UK is 68,206,927 as of Thursday, May 27, 2021, based on Worldometer elaboration of the latest United Nations data. The United Kingdom 2020 population is estimated at 67,886,011 people at mid year according to UN data.
The United Kingdom population is equivalent to 0.87% of the total world population. The U.K. ranks number 21 in the list of countries (and dependencies) by population. The population density in the United Kingdom is 281 per Km2 (727 people per mi2).
The total land area is 241,930 Km2 (93,410 sq. miles). 83.2 % of the population is urban (56,495,180 people in 2020). The median age in the United Kingdom is 40.5 years.
 |
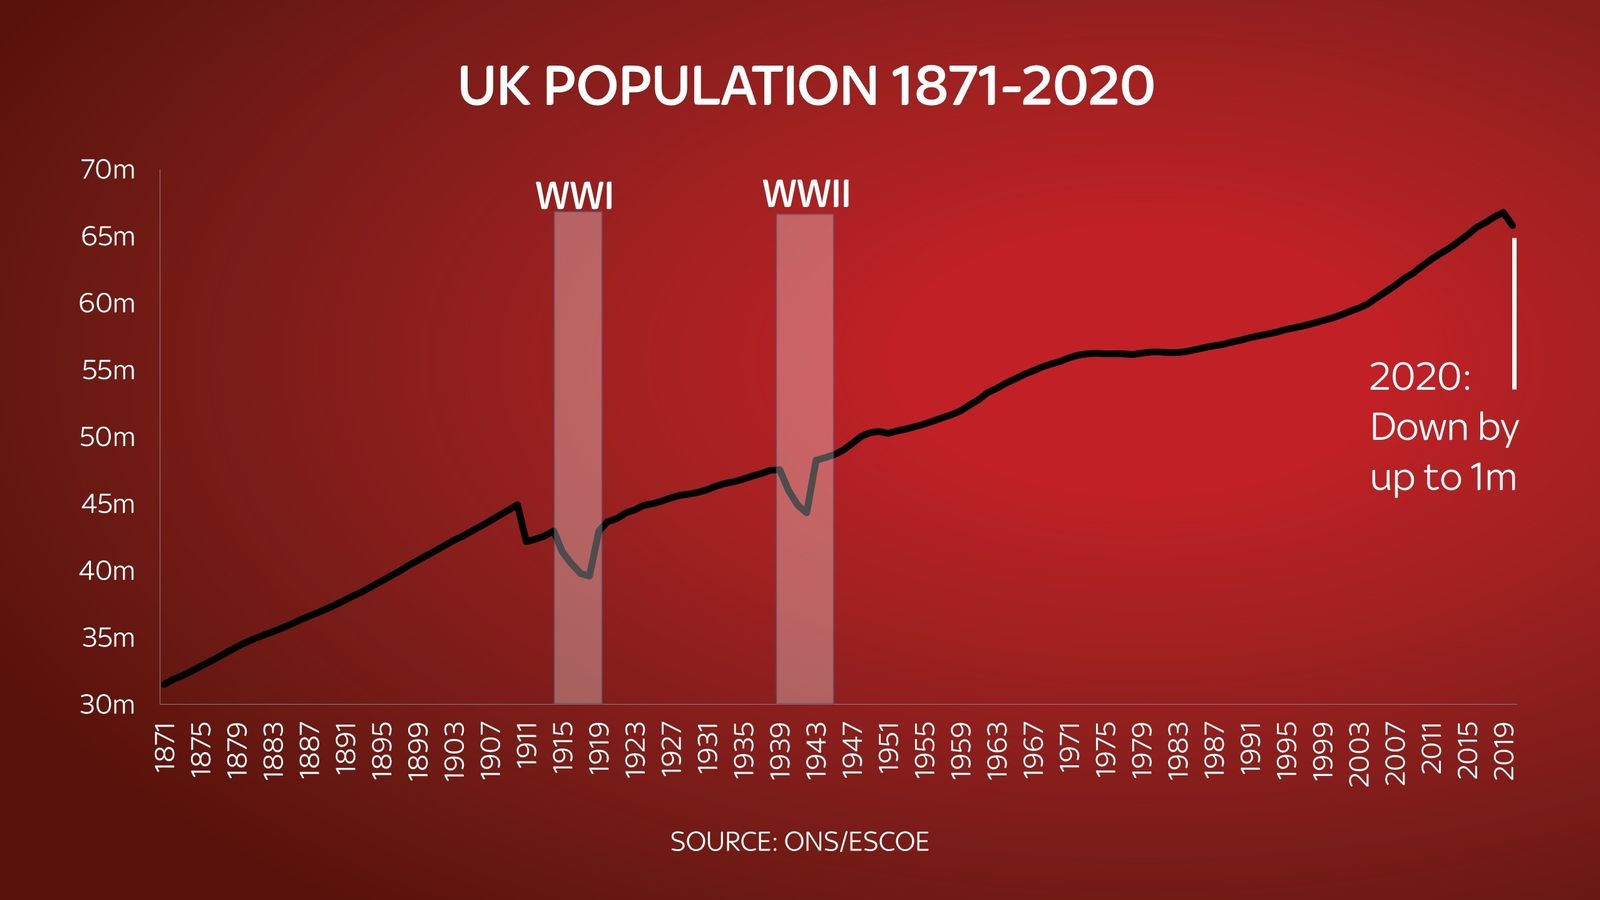
| Photo: Sky News |
Population of the United Kingdom (2020 and historical)
The UK population has grown year-on-year since 1982. The 2019 mid-year population estimates release showed that the population of the UK reached 66.8 million, up from 66.4 million in mid-2018. This population growth marks an increase of 0.5%, or an additional 361,000 people, between mid-2018 and mid-2019. Growth in the year mid-2018 to mid-2019 was slower than in any year since mid-2004. The UK population's growth rate from mid-2018 to mid-2019, at 0.5%, was slower than any year since mid-2004.
Between 2016 and 2019, long-term international immigration, emigration and net migration had remained broadly stable. However, in year ending December 2019 and year ending March 2020 (the latest data available), there was an increase in immigration and net migration.
Migration has continued to be the main driver of the UK's population growth since the 1990s. It is projected that there will be an additional 7.5 million people aged 65 years and over in the UK in 50 years' time.
Latest life expectancy figures show the slowdown in improvements seen since 2011 has continued; life expectancy at birth was 79.4 years for males and 83.1 years for females in the period 2017 to 2019.
| Year | Population | Yearly % Change | Migrants (net) | Median Age | Fertility Rate | Density (P/Km²) | Country's Share of World Pop | U.K. Global Rank |
|---|---|---|---|---|---|---|---|---|
| 2020 | 67,886,011 | 0.53 % | 260,650 | 40.5 | 1.75 | 281 | 0.87 % | 21 |
| 2019 | 67,530,172 | 0.58 % | 260,650 | 40.1 | 1.84 | 279 | 0.88 % | 21 |
| 2018 | 67,141,684 | 0.62 % | 260,650 | 40.1 | 1.84 | 278 | 0.88 % | 21 |
| 2017 | 66,727,461 | 0.65 % | 260,650 | 40.1 | 1.84 | 276 | 0.88 % | 21 |
| 2016 | 66,297,944 | 0.66 % | 260,650 | 40.1 | 1.84 | 274 | 0.89 % | 21 |
| 2015 | 65,860,146 | 0.75 % | 260,046 | 40.0 | 1.87 | 272 | 0.89 % | 21 |
| 2010 | 63,459,808 | 1.03 % | 437,881 | 39.5 | 1.86 | 262 | 0.91 % | 21 |
| 2005 | 60,287,954 | 0.46 % | 198,445 | 38.7 | 1.66 | 249 | 0.92 % | 21 |
| 2000 | 58,923,309 | 0.34 % | 102,672 | 37.6 | 1.74 | 244 | 0.96 % | 21 |
| 1995 | 57,932,453 | 0.28 % | 41,089 | 36.5 | 1.78 | 239 | 1.01 % | 19 |
| 1990 | 57,134,391 | 0.25 % | 19,752 | 35.8 | 1.84 | 236 | 1.07 % | 15 |
| 1985 | 56,413,553 | 0.07 % | -19,499 | 35.4 | 1.78 | 233 | 1.16 % | 15 |
| 1980 | 56,209,171 | 0.02 % | 7,824 | 34.4 | 1.73 | 232 | 1.26 % | 14 |
| 1975 | 56,152,333 | 0.21 % | 21,283 | 34.0 | 2.01 | 232 | 1.38 % | 13 |
| 1970 | 55,573,453 | 0.49 % | -16,971 | 34.2 | 2.57 | 230 | 1.50 % | 12 |
| 1965 | 54,240,850 | 0.70 % | 28,614 | 35.1 | 2.81 | 224 | 1.62 % | 9 |
| 1960 | 52,370,602 | 0.51 % | 13,993 | 35.6 | 2.49 | 216 | 1.73 % | 9 |
| 1955 | 51,063,902 | 0.18 % | -83,006 | 35.1 | 2.18 | 211 | 1.84 % | 9 |
United Kingdom Population Forecast
The UK population is projected to increase further; our 2018-based principal national population projections suggest the UK population will surpass 69.6 million by mid-2029 and reach 72 million by mid-2041 – increases of 4.2% and 7.8%, respectively, from mid-2019.
| Year | Population | Yearly % Change | Migrants (net) | Median Age | Fertility Rate | Density (P/Km²) | Country's Share of World Pop | U.K. Global Rank |
|---|---|---|---|---|---|---|---|---|
| 2020 | 67,886,011 | 0.61 % | 260,650 | 40.5 | 1.75 | 281 | 0.87 % | 21 |
| 2025 | 69,273,640 | 0.41 % | 153,644 | 41.4 | 1.75 | 286 | 0.85 % | 21 |
| 2030 | 70,485,490 | 0.35 % | 158,528 | 42.4 | 1.75 | 291 | 0.82 % | 22 |
| 2035 | 71,548,760 | 0.30 % | 165,236 | 43.3 | 1.75 | 296 | 0.81 % | 22 |
| 2040 | 72,486,891 | 0.26 % | 165,190 | 44.1 | 1.75 | 300 | 0.79 % | 23 |
| 2045 | 73,346,427 | 0.24 % | 165,457 | 44.5 | 1.75 | 303 | 0.77 % | 24 |
| 2050 | 74,081,981 | 0.20 % | 165,836 | 44.5 | 1.75 | 306 | 0.76 % | 26 |
Impact of the coronavirus (COVID-19) on population and migration statistics
There have been quite a number of pandemics in previous centuries which resulted in large numbers of deaths. For example, the Justinian plague that possibly halved the world’s population in the 6th Century, the Bubonic Plague in the 1300s and more recently, the 1918 infuenza pandemic that caused around 50 million deaths worldwide, including 228,000 deaths in Britain, reported ONS.
Deaths
During the COVID-19 outbreak, weekly deaths have been at their highest recorded level and compared to pandemics that have occurred in recent history, the death rate has been much higher for older people. Some of these may have occurred in the near future anyway, which could reduce the number of deaths in the coming period. Conversely, it has also been suggested that COVID-19 is and will be indirectly responsible for some deaths because of lower numbers seeking and undergoing treatment for other conditions. This would include people who could have gone on to live for many more years. The long-term health outlook of COVID-19 survivors is also not yet understood and may influence deaths’ patterns in the future.
Overall, this means there are liable to be factors impacting in opposite directions. The most effective way to measure the impact of COVID-19 on long-term mortality patterns is to look at all deaths that are above what would normally be expected (excess mortality) and continue to monitor this over the coming months and years. ONS has work underway investigating the long-term impact of COVID-19 on survivor’s health, which will be published in early 2021.
Births
Although not directly comparable, past events that caused high numbers of deaths resulted in an initial decline in births, followed by higher numbers around 1 to 5 years after the event, which influences the population structure, for example, the period following WW1. This time, the coronavirus pandemic has fallen within a time of decreasing fertility trends and there are factors which may impact in opposite directions. The lockdown period may result in more births, since couples are less likely to have spent time away from each other. In addition, family planning services may have been accessed less frequently.
However, the economic uncertainty resulting in loss of income and lower job prospects may be encouraging some couples to delay having children, and the formation of new relationships will be reduced under the lockdown conditions. Fertility treatments are also likely to have been accessed less. This may simply delay when people have children but delays can also mean couples having fewer children. Therefore, any long-term change in fertility that may have been caused by the coronavirus pandemic will be difficult to see for several years.
Migration
Before the pandemic, long-term international migration to the UK had been broadly stable since 2016, although the 12 months leading up to the coronavirus pandemic saw migration levels increase, driven by increases in non-EU student arrivals mainly from China and India. Our latest estimate of net migration is 313,000 for the year ending March 2020, which does not include the significant impact the pandemic has had on international migration since then. There has been a decrease in international travel to and from the UK in recent months. Because of the restrictions, the numbers of international migrants to and from the UK are likely to be low from March 2020. It is difficult to predict the longer-term picture, due to the potential impact of the end of the transition period for the UK’s departure from the European Union, ending freedom of movement between the UK and EU. However, COVID-19 has implications for international study and relative economic conditions affecting the likelihood of finding work. Global uncertainty regarding travel restrictions and the threat of subsequent waves of infection may tempt people to stop or delay their plans to move abroad.
READ MORE: How Many People - Update Population in the US, UK, China, India and Around the World
 How Many People Are There in China - Updated Population How Many People Are There in China - Updated Population China population has more than doubled since the 1950s. The country was the first in the world to hit one billion people in 1980. Check ... |
 How Many People Are There In The World: Population Update & Analysis How Many People Are There In The World: Population Update & Analysis How many people are living on Earth with us right now? How has the world population changed in recent years? Check out the answer below! |
 Top 9 Biggest Countries in the World by Population (Updated) Top 9 Biggest Countries in the World by Population (Updated) Below you will find the most up-to-date list of population figures by country. Check out Top 9 Biggest Countries in the World - Most ... |


